
2024 was a record year for the UCITS exchange-traded funds (ETF) market, with inflows exceeding EUR 250 billion – 60% up on 2023. Significant trends help explain the growth, not least the strength of US equities and the rise of active ETFs, writes Daniel Dornel, Head of ETF Research.
US equities dominate
Last year, US equity markets again had outstanding performance. They gained around 25%, led principally by the ‘Magnificent 7’ and the wider IT and communications services sectors.
Over the year, flows into US equity ETFs surged to reach a record level of around EUR 100 billion – some 40% of total UCITS ETF inflows. Worthy of note is that more than half of the 2024 flows into US equity ETFs came in the fourth quarter, particularly after Donald Trump won the presidential election.
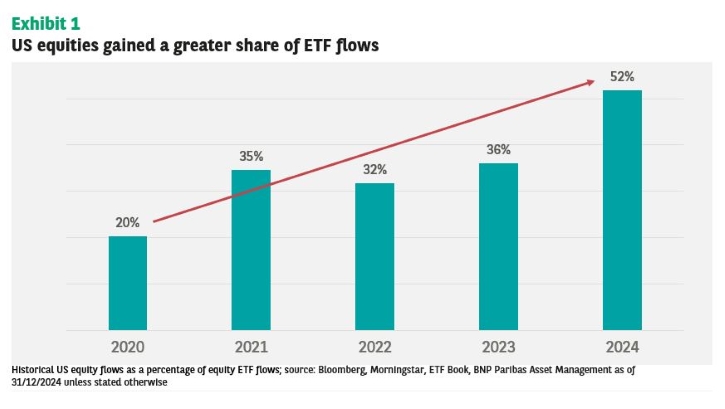
Flows into US equity ETFs have always represented a significant share of overall equity ETF flows, but we have seen this accelerate over the last five years from 20% in 2020 to more than 50% last year (Exhibit 1).
It is interesting to note that around 70% of the US equity flows went into ‘vanilla’ core exposures, with ETFs that replicate the S&P 500 index representing most of the net new cash.
ESG equity inflows lose out to low tracking error products
In 2024, ESG-related flows represented ‘only’ 17% of total net new cash. Flows into ESG equity products were impacted the most, while fixed income flows were more resilient.
We believe the main reason for this difference is the relatively low impact that ESG considerations have in terms of tracking error compared to mainstream fixed income indices.
A closer look at the flows of ESG equity products reveals a more complex dynamic than the lower ESG net new cash seen in 2024. Since the beginning of the year, divergent trends can be identified for different ESG approaches.
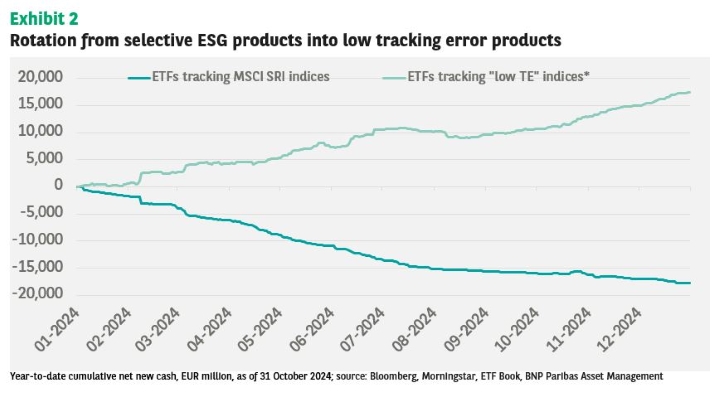
We saw a downward trend on ETFs tracking MSCI SRI indices, with outflows exceeding EUR 15 billion (see Exhibit 2).
ETFs that track ESG assets can be highly selective due, among other things, to extensive controversial business exclusions. They also select only the top 25% in terms of market value per sector, based on ESG ratings.
Such selectivity implies that MSCI SRI indices tend to have a relatively high tracking error (TE) versus traditional benchmarks, so their performance can deviate significantly from that of traditional indices.
At the same time, the trend on ‘lower tracking error’ products was positive, with more than EUR 12 billion in net new cash since the beginning of 2024.
Products in this category follow different index methodologies. The common point is that they aim to track the parent index more closely, typically with a maximum TE of around 1%. They also tend to have fewer sector/country deviations as the embedded ESG considerations are not as selective as those of the SRI indices.
However, they still aim at improving the ESG profile through excluding controversial businesses (less so than for SRI indices), improving ESG scores/ratings or carbon reduction.
The year of active ETFs
Like the trend in the US, we have seen a marked increase in the pace of growth of active UCITS ETFs. Active ETFs are not new in Europe, but before 2020, most such activity involved money market or ultrashort products.
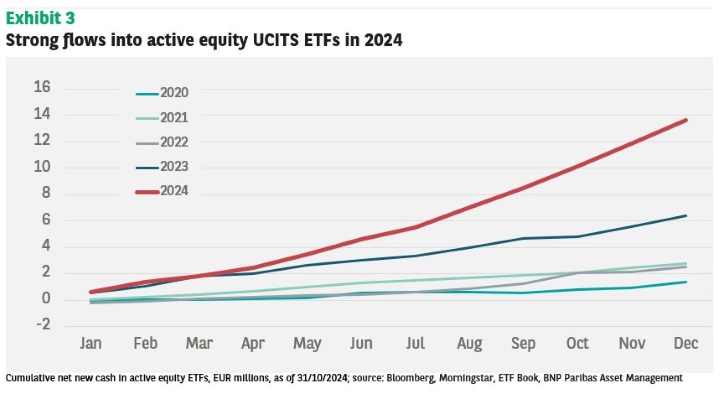
Over the last five years, we have seen increasing interest among investors for equity-related strategies. Last year, more than EUR 13 billion was invested in actively managed equity ETFs. As Exhibit 3 shows, this was a much faster growth rate than in the preceding years.
Overall, active ETFs represented around 7% of total ETF flows and less than 3% of UCITS ETF assets under management in 2024.
Yet the impressive growth trend in active ETFs is not limited to inflows. In 2024, more than 15% of newly launched ETFs were actively managed ones – some 40 new products. It is also worth noting that some asset managers used actively managed products as an opportunity to enter the ETF market.


