
In this new paper, we show how a low-risk equity strategy has performed during the Covid crisis, the Magnificent 71 tech stock rally, and the current US tariff turmoil: even in the face of a strong bull market, the strategy outperformed2 both the MSCI World and MSCI World Equal Weighted indices.
The low-risk anomaly
The low-risk anomaly first documented by Robert A. Haugen and A. James Heins in the 1970s refers to the persistent outperformance of low-volatility stocks over their riskier counterparts. Traditional financial theory suggest that higher risk should be rewarded with higher returns. However, real-world frictions such as leverage constraints, benchmark-driven mandates, and behavioural biases affect this relationship.
As a result, low-volatility stocks have consistently delivered superior risk-adjusted returns across various markets and sectors.
While many early low-volatility equity strategies focused on defensive sectors, our research has demonstrated that this anomaly persists across all sectors, including cyclical and high-growth areas such as technology and industrials.
This sector-level consistency reinforces the robustness of the anomaly and supports a sector diversified approach to low-risk equity investing.
Optimising our low-risk equity strategies
We launched our optimised low-risk equity strategies in 2011 to deliver long-term benchmark-like returns with lower volatility by systematically capturing the low-risk anomaly through a disciplined, sector-diversified and benchmark-aware quantitative approach.
While the stock selection process was initially based solely on volatility, it was enhanced in 2023 with a composite risk score that combines volatility with balance sheet-based risk measures.
This change was motivated by our research, which demonstrated that the composite score provides a more robust assessment of financial resilience and improves performance consistency.
How did the strategies do?
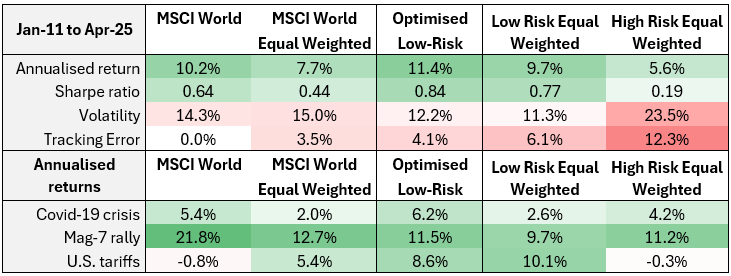
The strong bull market between January 2011 and April 2025, in which the MSCI World index delivered an above-average Sharpe ratio3 of 0.64, would appear to be ideal for an approach that favoured higher risk to earn an above-average returns.
However, our optimised low-risk strategy outperformed the MSCI World – and the MSCI World Equal Weighted index – at least before management fees, transaction costs and market impact, while maintaining lower volatility than that of the MSCI indices.
This outperformance highlights the effectiveness of a disciplined benchmark-aware low-risk approach in generating superior returns with controlled market exposure.
To further illustrate the added value of our approach, exhibit 1 includes a simple strategy that invests in the lowest-risk stocks within each sector, applying equal weighting both to stocks within sectors and to the sectors themselves. This approach is neither adequately risk-controlled nor benchmark-aware, which is reflected in its high tracking error risk4.
We also include a similar strategy that invests in the highest-risk stocks to illustrate the low-risk anomaly, demonstrating the consistently poor performance of high-risk stocks.
Exhibit 1
Annualised cumulated returns, volatility, Sharpe ratio and tracking error risk of the optimised low-risk strategy
Based on monthly total returns in US dollars. Transaction costs, market impact and management fees have not been considered. For illustration purposes only. As a result of currency fluctuations, returns can increase or decrease. Source: BNP Paribas Asset Management, MSCI, Worldscope, FactSet
Performance in challenging times
Since 2020, the optimised low-risk equity strategy was tested across three distinct and demanding market regimes:
- During the January 2020-December 2022 Covid crisis, the optimised low-risk strategy outperformed both the MSCI World and MSCI World Equal Weighted indices amid heightened market volatility and significant macroeconomic uncertainty.
- During the January 2023-December 2024 Mag-7 rally, a period dominated by the rally in seven mega-cap tech stocks, the strategy underperformed the exceptional absolute returns of the MSCI World index. Nevertheless, its performance remained competitive relative to the MSCI World Equal Weighted index.
- During the January 2025-April 2025 US tariff turmoil, the strategy rebounded sharply. While the MSCI World index experienced a slight decline, the strategy delivered a strong positive return, recovering its lag during the Mag-7 rally. Over this period, it outperformed both the MSCI World and MSCI World Equal Weighted indices, underscoring its resilience in volatile market conditions.
Valuable insights
In summary, the optimised low-risk strategy discussed in our recent paper – which is a good proxy for the strategy used in our low-risk equity funds – makes the case for benchmark-aware, low-risk investing in equities by maintaining a manageable tracking error relative to the MSCI World index.
Between January 2011 to April 2025, it delivered a superior performance, outpacing the MSCI World with lower volatility; this is an impressive outcome given the strength of the bull market. Its outperformance during shorter-term shocks such as the Covid crisis and this year’s gyrations over the US import tariff proposals highlights its defensive nature in protecting portfolios when most needed.
That said, underperformance can be expected in periods of exceptional market rallies such as the extraordinary surge driven by the Mag-7 stocks.
Read THE CASE FOR LOW-RISK EQUITY INVESTING: EVIDENCE FROM 2011-2025.
[1] Apple, Meta, Tesla, Microsoft, Nvidia, Amazon and Alphabet
[2] As suggested by simulations using total returns and before management fees, transaction costs and market impact.
[3] The Sharpe ratio indicates how much excess return an investment generates for each unit of risk taken, calculated as the difference between the portfolio return and the risk-free rate, divided by the portfolio’s standard deviation. Cash rates are used as a proxy for the risk-free rate.
[4] Tracking error risk is a measure of the deviation between the returns of a portfolio and its benchmark, typically expressed as the standard deviation of the difference in returns over time. It quantifies how closely a portfolio follows its benchmark.


