
Irrespective of who wins the presidential election, it looks certain that the next US government will maintain a protectionist stance on trade with China given the support it has from both the Republican and Democratic parties.
Indeed, the current Biden-Harris administration has kept most of former President Donald Trump’s tariffs on China and has focused on the technology sector, particularly electric vehicles and batteries – markets that China dominates.
In addition to restricting exports, tariffs are the common bipartisan tool for managing competition, so it is worth assessing the impact any additional tariffs could have on growth in China and beyond.
What would be the impact of a 60% tariff?
A good starting point is Trump’s campaign proposal of a 60% tariff rate on all Chinese imports.
Beijing will not be able to retaliate tit-for-tat because China imports much less from the US than the US imports from China: in 2023, China’s imports from the US totalled just USD 156 billion compared to US imports from China totalling USD 464 billion.[1]
We need two key economic parameters to gauge the direct impact of US tariffs on China:
- The pass-through rate which measures the possible effect of tariffs on the prices of the traded goods
- The price elasticity of demand which estimates the change in demand for imports as tariffs induce changes in the prices of goods.
Under a tariff shock, a Chinese exporter may pass through higher tariff-induced prices fully. In the case of a partial pass-through, the exporter will absorb part of the tariffs through a lower profit.
In the US, when tariffs push up Chinese import prices, consumer demand for these imports will likely fall. The magnitude of the decline depends on price elasticity. When demand is elastic, a one-percent rise in prices will lead to a drop in demand by more than one percent. In this case, price elasticity is greater than -1.
There are no consistent estimates for the tariff pass-through rate and the price elasticity of demand coefficient of a country, including China. Empirical studies[2] have shown that the pass-through rate could range between 10% and 30% and price elasticity could hover between -2 and -7.
Let us take the mid-points of these estimates for our analysis, i.e., 20% for tariff pass-through and -4.5 for demand elasticity.
These assumptions imply that a 60% tariff rate would boost Chinese import prices by:
- 12% (= 20% x 60% tariffs)
It would reduce US import demand by:
- 54% (= 12% x -4.5), ceteris paribus.
Total value of US imports of Chinese goods would thus fall by:
- 42% (= 54% decline in volume minus 12% rise in price).
This, in turn, means that in the year after the tariffs are imposed, US demand for Chinese imports (i.e., China’s exports to the US) would fall by
- USD 195 billion (= USD 464 billion x 42%) or
- 1.1% of China’s GDP (= USD 195 billion out of USD 17.7 trillion GDP in 2023).
Any tariffs below 60% would have a smaller impact. However, if the tariff pass-through rate and demand elasticity were higher than assumed, the impact would be bigger.
Manageable fallout in China
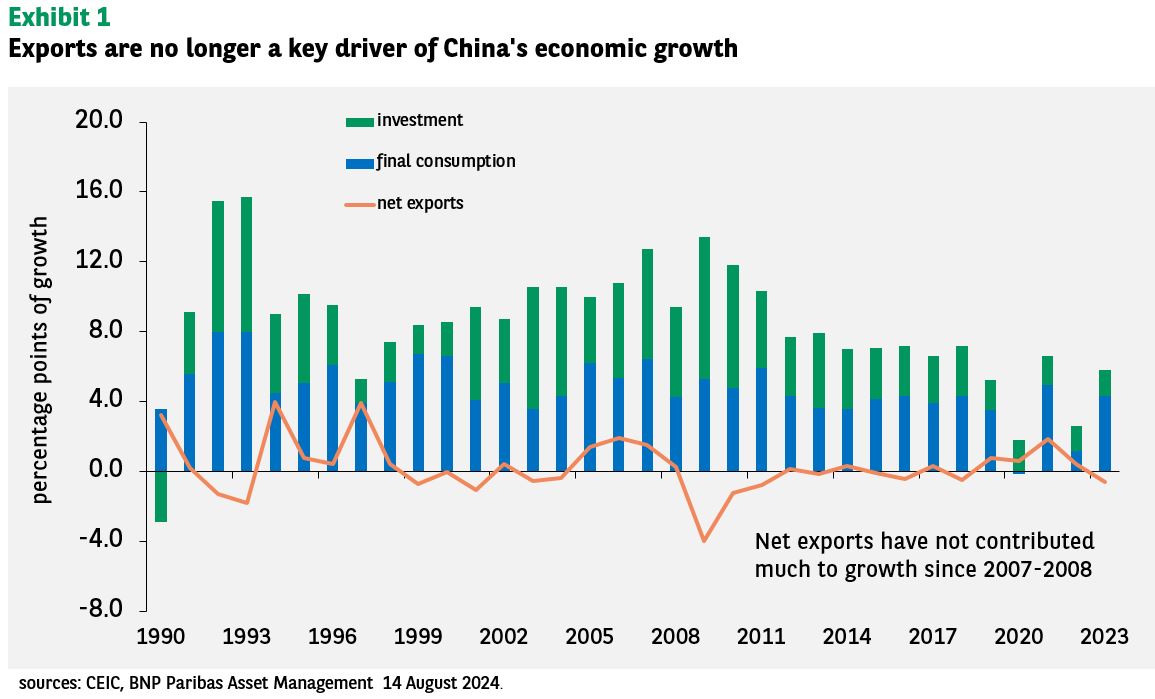
The estimated drag on China’s growth should still be manageable. Beijing could easily offset it by fiscal pump-priming to boost domestic demand. This underscores the evidence that the economy is no longer export driven. Since the 2007-08 Global Financial Crisis, net exports have only been an auxiliary driver of GDP growth (see Exhibit 1).
However, this estimate considers only the primary impact on China’s growth. If we consider the effects of the tariff shock on local confidence and asset prices (which could affect domestic demand), and the effect of rising protectionism on global trade and demand, growth could be hit harder.
Some market players estimate the loss of growth to be 2.5 percentage points a year.
Implications beyond China
Other countries could also be affected. Since it is not clear how the US would treat imports via other countries[3], an accurate estimate is impossible. However, we can still assess the global impact by using trade diversion data.
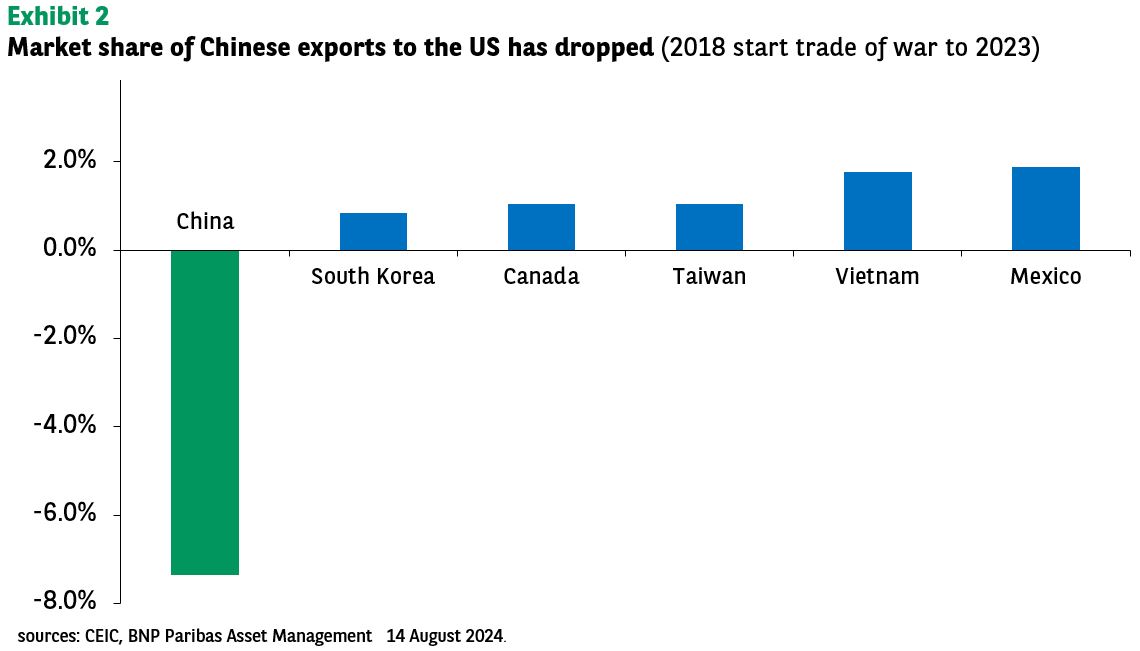
Official data shows that Mexico, Vietnam, Taiwan, South Korea, and Canada benefited significantly from the Sino-US trade war: they gained market share in the US at the expense of China[4] (see Exhibit 2). Furthermore, the trade war has caused a shift in regional supply chains, favouring the ASEAN region and Mexico.[5]
To hedge against the impact of US tariffs, China has intensified its direct investments in, and exports to, ASEAN and Mexico (see Exhibits 3 and 4). Overseas Chinese firms have been able to source inputs from China for manufacturing in these regions, with the goods then exported to the US. Thus, it circumvents many US tariffs.
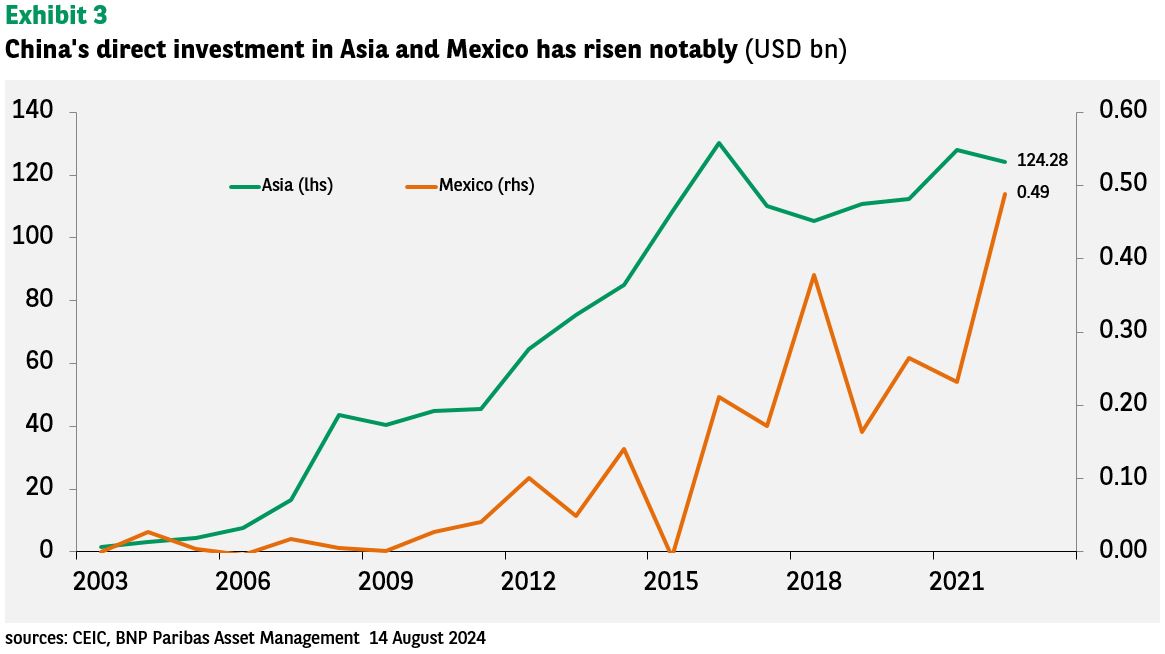
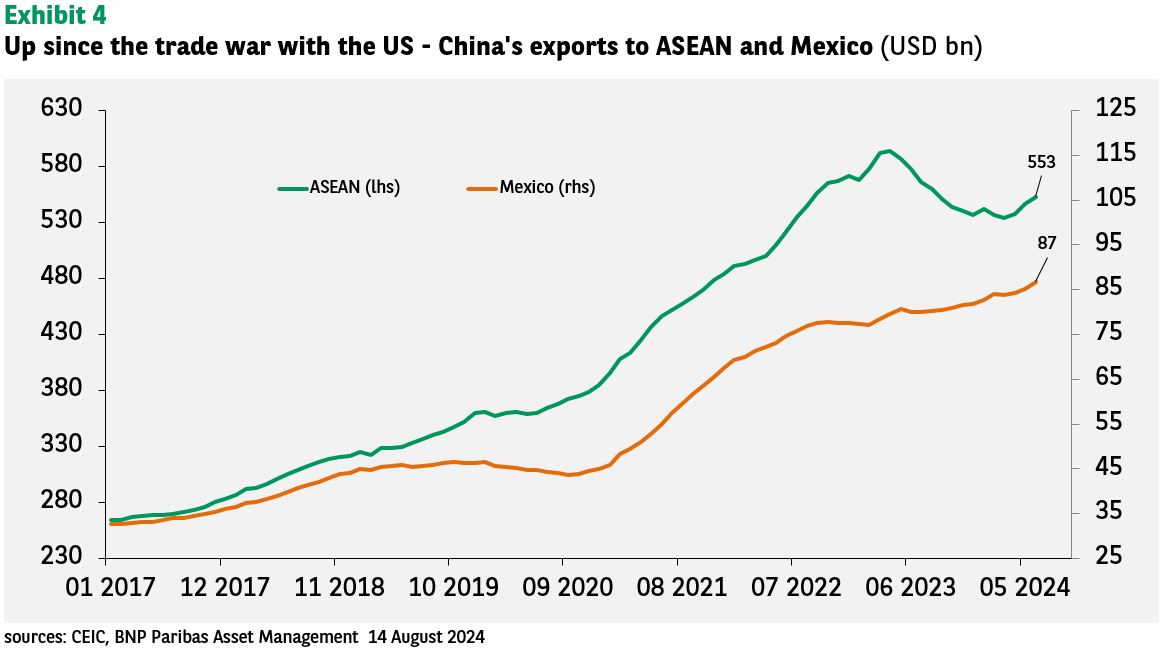
From an Asian perspective, this indirect route for Chinese exports to the US has boosted intra-regional trade, benefiting regional economies. This development has also ushered in a structural change in the regional supply chains, which integrates China more closely with Asia, refuting the decoupling narrative.[6]
Expanding China’s export markets
Taking a long-term view, there is an important counteracting factor to the impact of US tariffs on China that conventional wisdom has overlooked: China’s export expansion to other markets, notably the Belt and Road Initiative (BRI) countries. This has been offsetting the slowdown in exports to the US.
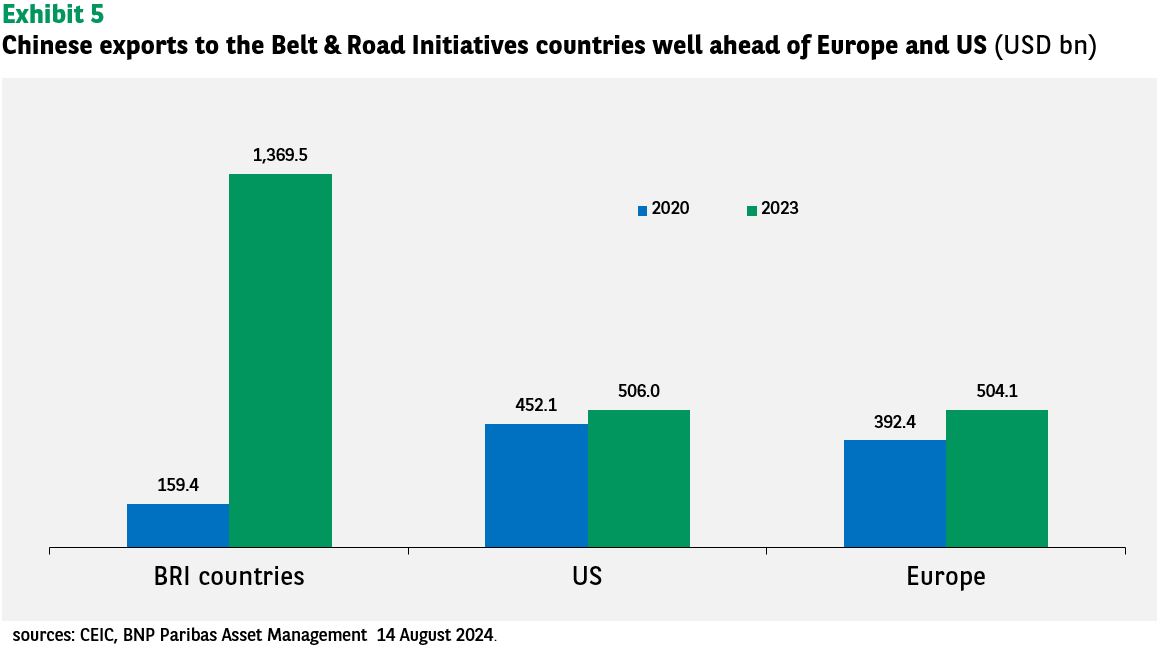
China is exporting more to the BRI countries than to Europe and the US (see Exhibit 5), both because of the expansion of its trade and, more importantly, a threefold increase in the number of BRI countries.[7]
Beyond tariffs, further US export restrictions on technology goods and knowhow will likely bring uncertainties to China and the global outlook.
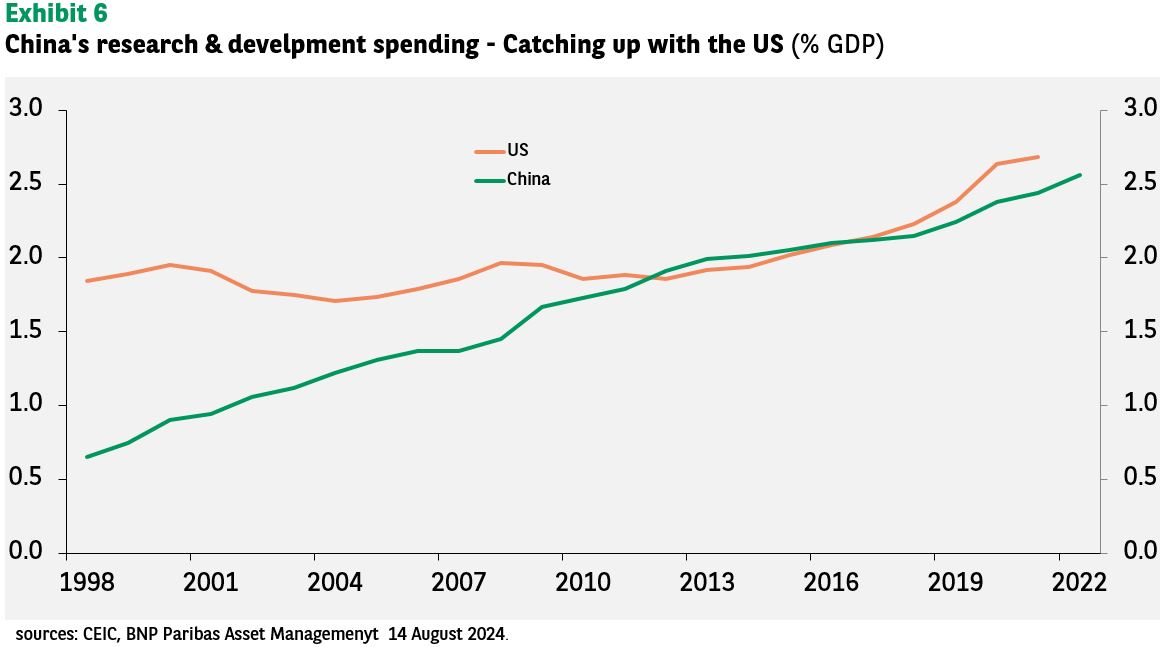
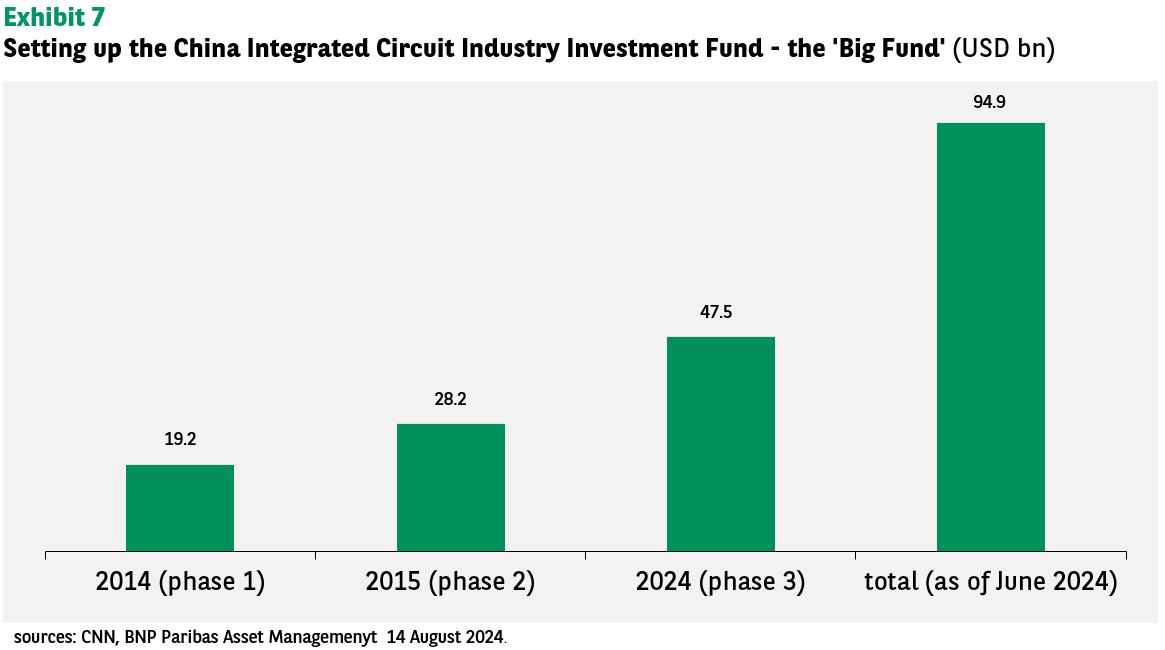
To tackle this, China has boosted its research and development (R&D) spending, almost matching the relative level in the US (see Exhibit 6). It has also poured billions into its microchip industry, notably by creating the USD 95 billion ‘Big Fund’ – the China Integrated Circuit Industry Investment Fund (see Exhibit 7).
Arguably, US tech export restrictions can only bolster China’s resolve to become tech self-sufficient. This is one of the key objectives of its ‘dual circulation’ development strategy to counter external pressures and shifts in global demand.[8]
Bolstering tech development in China
Efforts to boost the development of technology are showing results – China’s dominance in the global electric vehicles market is a notable example with global market and energy transition implications.[9]
Even in the production of advanced semiconductor chips, China’s rapid progress can be said to run counter to the conventional view that its semiconductor industry would stumble at the technology frontier due to the US-led tech export restrictions policy.
The August 2023 release of a 7-nanometer chip powering Huawei’s high-end smartphone showed that China’s self-sufficiency in semiconductor design (by HiSilicon, owned by Huawei) and manufacturing capabilities (by SMIC) were catching up at a pace few had expected.
Mass production of 5 nanometer chips has fuelled talk of likely further leaps in next-generation chips. Furthermore, there are plans to ship a microchip – Ascend 910C by Huawei and SMIC – for artificial intelligence, rivalling the omnipresent US-made H100 microchip by Nvidia. The US has banned exports to China for national security reasons.
Granted, these chips are still a generation behind the developed world’s cutting-edge 3-nanometer chips. However, they show that China can move fast despite US-imposed obstacles.
Looking for growth at home and abroad
As said, in the short term, China is unlikely to retaliate against higher US tariffs given its relatively limited imports from the US. It looks likely to respond with a targeted approach. Beijing could also renew its focus on the BRI to expand its export markets.
To lessen the impact on the domestic economy, Beijing may intensify fiscal pump-priming as the domestic (including the public) sector is the prime driver of growth, and not exports (see Exhibit 1).
To facilitate fiscal expansion, the central bank will likely have to ease monetary policy further and for longer under an impaired monetary transmission mechanism.
Finally, China will likely need to keep its real interest rate below the rate of real GDP growth for long enough to revive ‘animal spirits’, private investment and consumer spending in the face of a slowdown in external demand.
References
[1] US and Chinese official data, in fact, showed different numbers on trade between the two countries. We took the mid-point of the official numbers as the import data for our analysis.
[2] See Chi Time: China’s Growth in Case of a Full Scale Trade War, 19 September 2018.
[3] For example, China may export intermediate goods or parts to another country which sells to the US. That would result in a different tariff category with a higher or lower tariff rate than it would have been if China had sold directly to the US.
[4] These countries were the top five export market share gainers in the US between 2017 (before the Sino-US trade war) and 2023 (the latest data available).
[5] See Chi on China: China Decoupling or the Rise of Regionalism, 17 November 2023.
[6] See Chi on China: From US Tariffs to China Decoupling – Evidence and Implications, 7 June 2024.
[7] There were 54 BRI countries at inception in 2017. This has risen to 150 in 2023. Source:
[9] See Chi Flash: Tariffs on Chinese EVs and Implications on Energy Transition, 28 June 2024.


